| Record Information |
|---|
| Version | 1.0 |
|---|
| Creation Date | 2016-09-30 22:36:21 UTC |
|---|
| Update Date | 2020-06-04 21:45:59 UTC |
|---|
| BMDB ID | BMDB0000772 |
|---|
| Secondary Accession Numbers | |
|---|
| Metabolite Identification |
|---|
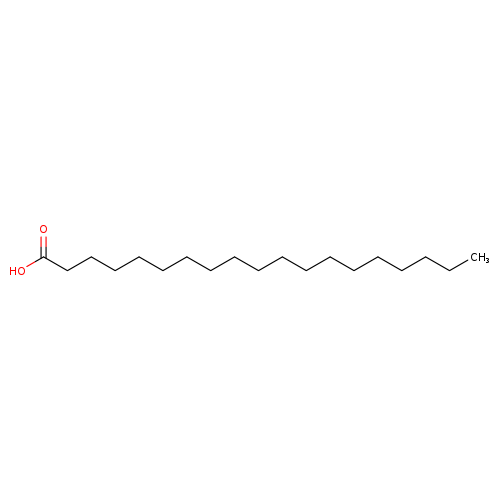
| Common Name | Nonadecanoic acid |
|---|
| Description | Nonadecanoic acid, also known as N-nonadecanoate or nonadecylate, belongs to the class of organic compounds known as long-chain fatty acids. These are fatty acids with an aliphatic tail that contains between 13 and 21 carbon atoms. Nonadecanoic acid exists as a solid, very hydrophobic, practically insoluble (in water), and relatively neutral molecule. Nonadecanoic acid is a potentially toxic compound. |
|---|
| Structure | |
|---|
| Synonyms | | Value | Source |
|---|
| 19:00 | ChEBI | | C19:0 | ChEBI | | N-Nonadecanoic acid | ChEBI | | Nonadecylic acid | ChEBI | | N-Nonadecanoate | Generator | | Nonadecylate | Generator | | Nonadecanoate | Generator | | N-Nonadecylate | HMDB | | N-Nonadecylic acid | HMDB | | FA(19:0) | HMDB | | Nonadecanoic acid | MeSH |
|
|---|
| Chemical Formula | C19H38O2 |
|---|
| Average Molecular Weight | 298.5038 |
|---|
| Monoisotopic Molecular Weight | 298.28718046 |
|---|
| IUPAC Name | nonadecanoic acid |
|---|
| Traditional Name | nonadecanoic acid |
|---|
| CAS Registry Number | 646-30-0 |
|---|
| SMILES | CCCCCCCCCCCCCCCCCCC(O)=O |
|---|
| InChI Identifier | InChI=1S/C19H38O2/c1-2-3-4-5-6-7-8-9-10-11-12-13-14-15-16-17-18-19(20)21/h2-18H2,1H3,(H,20,21) |
|---|
| InChI Key | ISYWECDDZWTKFF-UHFFFAOYSA-N |
|---|
| Chemical Taxonomy |
|---|
| Description | belongs to the class of organic compounds known as long-chain fatty acids. These are fatty acids with an aliphatic tail that contains between 13 and 21 carbon atoms. |
|---|
| Kingdom | Organic compounds |
|---|
| Super Class | Lipids and lipid-like molecules |
|---|
| Class | Fatty Acyls |
|---|
| Sub Class | Fatty acids and conjugates |
|---|
| Direct Parent | Long-chain fatty acids |
|---|
| Alternative Parents | |
|---|
| Substituents | - Long-chain fatty acid
- Straight chain fatty acid
- Monocarboxylic acid or derivatives
- Carboxylic acid
- Carboxylic acid derivative
- Organic oxygen compound
- Organic oxide
- Hydrocarbon derivative
- Organooxygen compound
- Carbonyl group
- Aliphatic acyclic compound
|
|---|
| Molecular Framework | Aliphatic acyclic compounds |
|---|
| External Descriptors | |
|---|
| Ontology |
|---|
| Status | Detected and Quantified |
|---|
| Origin | |
|---|
| Biofunction | Not Available |
|---|
| Application | Not Available |
|---|
| Cellular locations | - Adiposome
- Cell membrane
- Cytoplasm
- Membrane
|
|---|
| Physical Properties |
|---|
| State | Solid |
|---|
| Experimental Properties | | Property | Value | Reference |
|---|
| Melting Point | 69.4 °C | Not Available | | Boiling Point | Not Available | Not Available | | Water Solubility | Not Available | Not Available | | LogP | Not Available | Not Available |
|
|---|
| Predicted Properties | |
|---|
| Spectra |
|---|
| Spectra | | Spectrum Type | Description | Splash Key | |
|---|
| GC-MS | GC-MS Spectrum - GC-MS (1 TMS) | splash10-0159-2901000000-8299d54806ed60f141b2 | View in MoNA |
|---|
| GC-MS | GC-MS Spectrum - GC-MS (Non-derivatized) | splash10-0159-2901000000-8299d54806ed60f141b2 | View in MoNA |
|---|
| Predicted GC-MS | Predicted GC-MS Spectrum - GC-MS (Non-derivatized) - 70eV, Positive | splash10-0006-9450000000-5ddf2f951c9f519c8180 | View in MoNA |
|---|
| Predicted GC-MS | Predicted GC-MS Spectrum - GC-MS (1 TMS) - 70eV, Positive | splash10-05i9-9560000000-957f37701ff9a82672f7 | View in MoNA |
|---|
| Predicted GC-MS | Predicted GC-MS Spectrum - GC-MS (Non-derivatized) - 70eV, Positive | Not Available | View in JSpectraViewer |
|---|
| Predicted GC-MS | Predicted GC-MS Spectrum - GC-MS (Non-derivatized) - 70eV, Positive | Not Available | View in JSpectraViewer |
|---|
| Predicted GC-MS | Predicted GC-MS Spectrum - GC-MS (TBDMS_1_1) - 70eV, Positive | Not Available | View in JSpectraViewer |
|---|
| Predicted LC-MS/MS | Predicted LC-MS/MS Spectrum - 10V, Positive | splash10-000t-0090000000-6654f9a48cabdcfa7bd2 | View in MoNA |
|---|
| Predicted LC-MS/MS | Predicted LC-MS/MS Spectrum - 20V, Positive | splash10-0uej-3590000000-ea8bf266e2e56c80950c | View in MoNA |
|---|
| Predicted LC-MS/MS | Predicted LC-MS/MS Spectrum - 40V, Positive | splash10-052o-8930000000-74d1a96c59c53c06fed7 | View in MoNA |
|---|
| Predicted LC-MS/MS | Predicted LC-MS/MS Spectrum - 10V, Negative | splash10-0002-0090000000-d8acfab7a04e4b7e9a3a | View in MoNA |
|---|
| Predicted LC-MS/MS | Predicted LC-MS/MS Spectrum - 20V, Negative | splash10-0f6t-1090000000-1e0b05eaf614093c806f | View in MoNA |
|---|
| Predicted LC-MS/MS | Predicted LC-MS/MS Spectrum - 40V, Negative | splash10-0a4l-9230000000-5c078c32de5bf8b61786 | View in MoNA |
|---|
| Predicted LC-MS/MS | Predicted LC-MS/MS Spectrum - 10V, Positive | splash10-000t-2090000000-a0fd705e0619a1f47aa7 | View in MoNA |
|---|
| Predicted LC-MS/MS | Predicted LC-MS/MS Spectrum - 20V, Positive | splash10-053s-9370000000-c02fe769e6023d65c1c2 | View in MoNA |
|---|
| Predicted LC-MS/MS | Predicted LC-MS/MS Spectrum - 40V, Positive | splash10-0a4l-9000000000-5fed4c847cf0c01c8bf7 | View in MoNA |
|---|
| Predicted LC-MS/MS | Predicted LC-MS/MS Spectrum - 10V, Negative | splash10-0002-0090000000-34ccf1c2200e0131ae8c | View in MoNA |
|---|
| Predicted LC-MS/MS | Predicted LC-MS/MS Spectrum - 20V, Negative | splash10-002b-0090000000-4f9ff0b7c6bf7cd5b0f7 | View in MoNA |
|---|
| Predicted LC-MS/MS | Predicted LC-MS/MS Spectrum - 40V, Negative | splash10-0006-9130000000-0e59694e188057fbe82e | View in MoNA |
|---|
| MS | Mass Spectrum (Electron Ionization) | splash10-0596-9100000000-66d168f75966d615344a | View in MoNA |
|---|
| 1D NMR | 1H NMR Spectrum (1D, 500 MHz, CDCl3, experimental) | Not Available | View in JSpectraViewer |
|---|
| 1D NMR | 1H NMR Spectrum (1D, 90 MHz, CDCl3, experimental) | Not Available | View in JSpectraViewer |
|---|
| 1D NMR | 13C NMR Spectrum (1D, 25.16 MHz, CDCl3, experimental) | Not Available | View in JSpectraViewer |
|---|
| 1D NMR | 13C NMR Spectrum (1D, 100 MHz, H2O, predicted) | Not Available | View in JSpectraViewer |
|---|
| 1D NMR | 1H NMR Spectrum (1D, 100 MHz, H2O, predicted) | Not Available | View in JSpectraViewer |
|---|
| 1D NMR | 13C NMR Spectrum (1D, 1000 MHz, H2O, predicted) | Not Available | View in JSpectraViewer |
|---|
| 1D NMR | 1H NMR Spectrum (1D, 1000 MHz, H2O, predicted) | Not Available | View in JSpectraViewer |
|---|
| 1D NMR | 13C NMR Spectrum (1D, 200 MHz, H2O, predicted) | Not Available | View in JSpectraViewer |
|---|
| 1D NMR | 1H NMR Spectrum (1D, 200 MHz, H2O, predicted) | Not Available | View in JSpectraViewer |
|---|
| 1D NMR | 13C NMR Spectrum (1D, 300 MHz, H2O, predicted) | Not Available | View in JSpectraViewer |
|---|
| 1D NMR | 1H NMR Spectrum (1D, 300 MHz, H2O, predicted) | Not Available | View in JSpectraViewer |
|---|
| 1D NMR | 13C NMR Spectrum (1D, 400 MHz, H2O, predicted) | Not Available | View in JSpectraViewer |
|---|
| 1D NMR | 1H NMR Spectrum (1D, 400 MHz, H2O, predicted) | Not Available | View in JSpectraViewer |
|---|
| 1D NMR | 13C NMR Spectrum (1D, 500 MHz, H2O, predicted) | Not Available | View in JSpectraViewer |
|---|
| 1D NMR | 1H NMR Spectrum (1D, 500 MHz, H2O, predicted) | Not Available | View in JSpectraViewer |
|---|
| 1D NMR | 13C NMR Spectrum (1D, 600 MHz, H2O, predicted) | Not Available | View in JSpectraViewer |
|---|
| 1D NMR | 1H NMR Spectrum (1D, 600 MHz, H2O, predicted) | Not Available | View in JSpectraViewer |
|---|
| 1D NMR | 13C NMR Spectrum (1D, 700 MHz, H2O, predicted) | Not Available | View in JSpectraViewer |
|---|
| 1D NMR | 1H NMR Spectrum (1D, 700 MHz, H2O, predicted) | Not Available | View in JSpectraViewer |
|---|
| 1D NMR | 13C NMR Spectrum (1D, 800 MHz, H2O, predicted) | Not Available | View in JSpectraViewer |
|---|
| 1D NMR | 1H NMR Spectrum (1D, 800 MHz, H2O, predicted) | Not Available | View in JSpectraViewer |
|---|
| 1D NMR | 13C NMR Spectrum (1D, 900 MHz, H2O, predicted) | Not Available | View in JSpectraViewer |
|---|
| 1D NMR | 1H NMR Spectrum (1D, 900 MHz, H2O, predicted) | Not Available | View in JSpectraViewer |
|---|
| 2D NMR | [1H, 13C]-HSQC NMR Spectrum (2D, 600 MHz, CDCl3, experimental) | Not Available | View in JSpectraViewer |
|---|
|
|---|
| General References | - Jensen RG: The composition of bovine milk lipids: January 1995 to December 2000. J Dairy Sci. 2002 Feb;85(2):295-350. doi: 10.3168/jds.S0022-0302(02)74079-4. [PubMed:11913692 ]
- GARTON GA: THE COMPOSITION AND BIOSYNTHESIS OF MILK LIPIDS. J Lipid Res. 1963 Jul;4:237-54. [PubMed:14168161 ]
- Trimigno A, Munger L, Picone G, Freiburghaus C, Pimentel G, Vionnet N, Pralong F, Capozzi F, Badertscher R, Vergeres G: GC-MS Based Metabolomics and NMR Spectroscopy Investigation of Food Intake Biomarkers for Milk and Cheese in Serum of Healthy Humans. Metabolites. 2018 Mar 23;8(2). pii: metabo8020026. doi: 10.3390/metabo8020026. [PubMed:29570652 ]
- Glasser F, Ferlay A, Chilliard Y: Oilseed lipid supplements and fatty acid composition of cow milk: a meta-analysis. J Dairy Sci. 2008 Dec;91(12):4687-703. doi: 10.3168/jds.2008-0987. [PubMed:19038946 ]
|
|---|